Information graphics, or infographics, are visual representations of information, data or knowledge. The graphics are used where complex information needs to be explained quickly and clearly, such as on signs and maps and in journalism, technical writing and education.
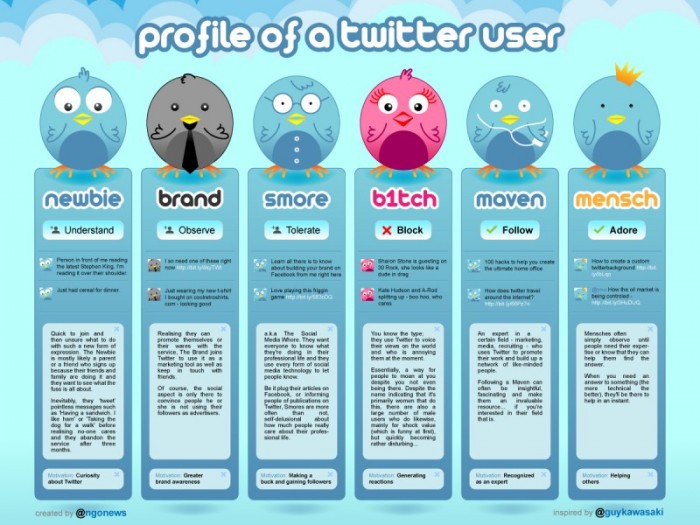
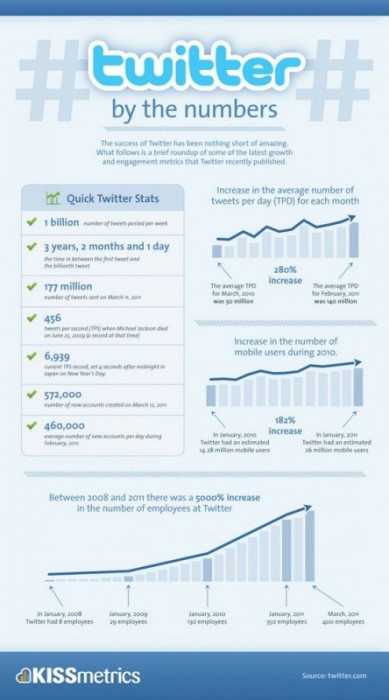
Every day twitter grow and grow and no one what’s the rate, here we represent 10 Infographics to get more informations about twitter.


