In the era of information, it’s hard to image any dashboard without graphs and charts. Charts are easy to understand and offer great information than a bunch of highly jumbled up stats floating through the screen.
With the idea in mind, I want to list the best JavaScript Charting libraries. The charting libraries are great for creating charts and graphs. Some of the charting libraries are composed of pre-made charts and some come with none.
JavaScript has a rich set of libraries and you as a developer can find tons of libraries for executing complex tasks. The notion of making tools and using them is what makes web development and computer science as a whole, the best thing.
So, why the wait? Let’s start our listing of best JavaScript Charting Libraries
Best JavaScript Charing Libraries
1. D3.js
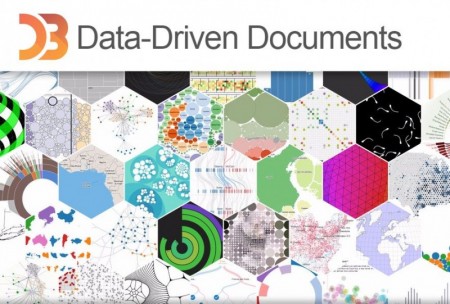
Creating Charts can be used in synonym with D3.js. With a powerful feature, the D3.js is the number one choice for programmers to create charts and graphs.
What makes it so special? The availability of powerful transition, “Enter and Exit” and syntax familiar to other languages. Another aspect that makes D3.js appealing to the designers is the rendering path used by the library. D3.js uses SVG, HTML and CSS for rendering purposes.
The library is open source and you can configure the package according to your requirements.
2. ChartJS
ChartJS is yet another open source JavaScript Charting library. It renders the most impressive charts out there and is best suited for both Developers and designers. It is modular in nature and support responsive design!
The library comes with six chart types and can be customized to heart’s content.

3. Ember Charts
Yet Another Open Source library that facilitates the creation of charts and graphs. What makes it worth your time? It is built using the D3.js and Ember.js.
Ember.js lovers can find this charting library very useful.
4. Google Charts
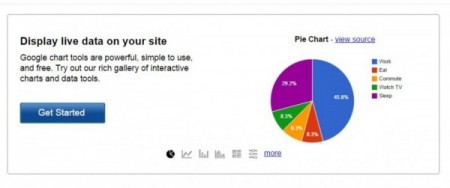
If you are looking for a pre-built solution and backing of assurance than Google Charts can prove useful for you. It comes with a lot of pre-defined charts.
Google Charts creates graphs/charts that are cross platform compatible and supports older IE browsers(an improvement over D3.js).
5. Flot
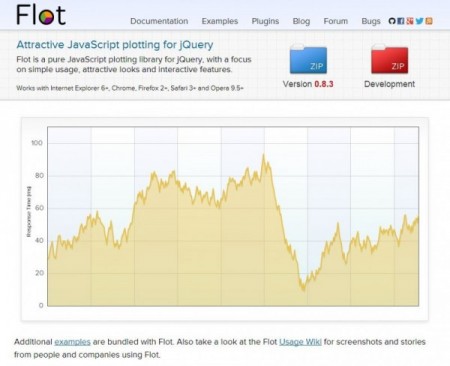
The Flot is yet another JavaScript charting library based on jQuery. So, what makes it popular? It’s age. The library works great on older browser such as IE6 or Firefox 2.
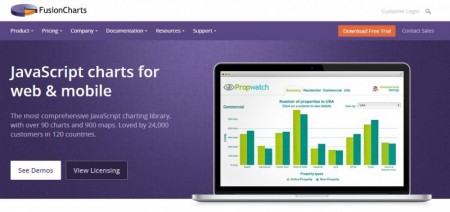
6. FusionCharts
With D3.js as one of the popular option for creating charts, FusionCharts does stand strong. It is one of the oldest JavaScript charting libraries and renders the charts using the HTML5/SVG pathways.
DataParsing in the library is achieved using the XML and JSON. There is also no compatibility issues with FusionCharts.
The only drawback is that it is not free and you need to purchase the license for removing the watermark that comes with the trial.
7. HighCharts
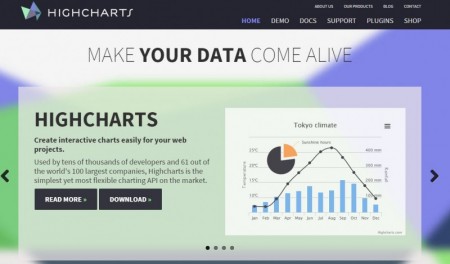
HighCharts is impressive in its own way. You can easily create charts for your projects and create visually appealing charts within minutes.
You can use HighCharts free for non-commercial projects. But, if you are planning to use HighCharts for commercial purpose, then you have to buy the license.
8. amCharts
amCharts is a standalone charting JavaScript library that works great for projects looking to visualize data. With three ways to create independent charts, you can easily create charts that are usable to a certain project.
You can create JavaScript charts, stock charts, and Maps Charts(amMaps). Drawback includes non-compatibility with IE9 and older version. Similar to few of the JavaScript libraries, amCharts also requires buying a license for removing the link to their website.
9. Chartist.js
Charlist.js is one of the best JavaScript Charting libraries. It is completely responsive and offers the use of SVG to create powerful charts. You can customize every bit of the map using the Sass.
Browser compatibility is high using the Chartist.js. With so much to offers, Chartist.js is surely usable in the projects.
10. Rickshaw
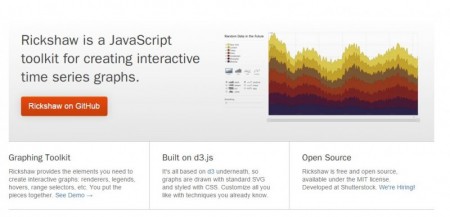
Rickshaw is a graph creating toolkit build on top of d3.js. The toolkit is free to use and open source in nature.
Rickshaw can be used to create simple graphs instantly. Their website is full of examples, which showcases how easy it is to make a graph/chart.
Wrap Up
With 10 best JavaScript Charting libraries listed, it is easy to get lost. My personal advice is to use d3.js as starting point if you are not sure or haven’t used any charting library in the past.
Other charting libraries also holds promise. It all depends on your requirement and capability to understand the best fit.

Solid list, but I’d consider adding ZingChart (http://www.zingchart.com) next time. Maybe not for people who just want a chart or two in a blog post or something, but it’s a legit library for serious charting.
please check http://www.anychart.com AnyChart – JS library