If you are not familiar with Photoshop , if you want to paint your ideas or statistic , infographic let you represent in brief way your long ideas and researches in a simple, compact and creative format. Nowadays, there’s a lot of tools that saves a lot of time and let you create your infographic in simple clicks.
In this post , I’ve compiled the top 6 of free tools you can use to create amazing visualizations.
Tools To Create Infographics
Piktochart
Althought its three themes ,Piktochart is customizable editor that allow you to uploaded images , change text styles you can buy the pro version for only 29$ and get 100 customizable templates.
Easel.ly
Easel.ly is free web-based tool for creating infographics , it offer the possibility of using templates or use a blan canvas . Users can use one of 10 categories including people, transportation, animals and icons in their graphic.
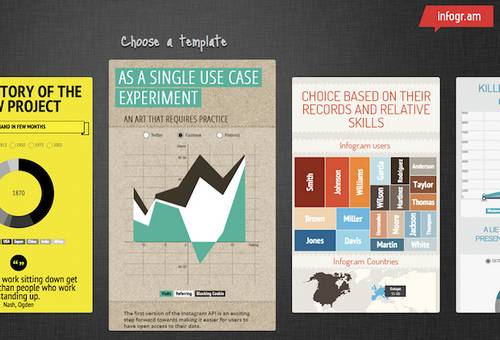
Infogr.am
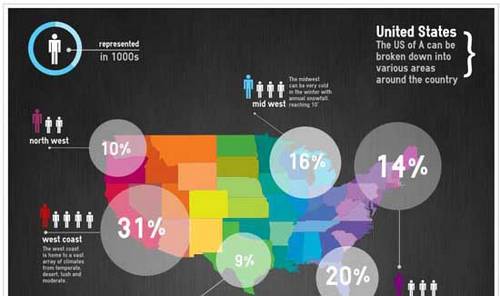
Infogr.am is free web-based tool that allow you make static and interactive infographics with really nice themes. There are 31 chart options that offer some really amazing displays, like a radial bar graph, bubble graphs, and map charts. You can after that easily share finished infographics though social media or use the embed code to place it on your own website.
Visual.ly
Visual.ly is a community platform for data visualization and infographics set up in 2011. For me it’s the best free tools , it allows you both to create infographics and get them shared on social media.
Vizualize.Me
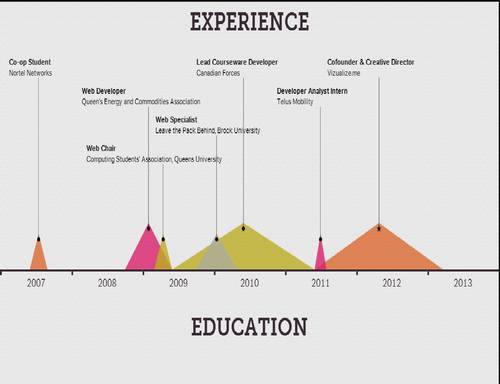
Vizualize.Me is an amazing tool that let you convert your LinkedIn profile into a beautiful infographic in one click.
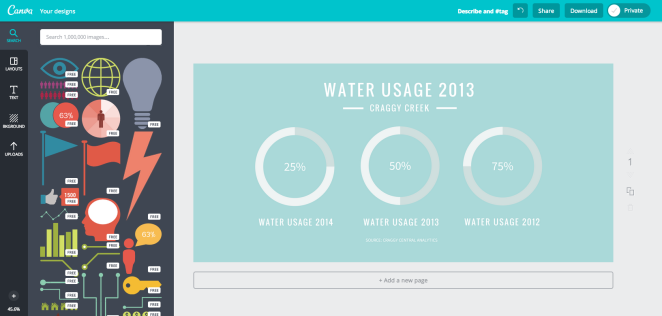
Canva – Easy Drag and Drop Infograhics Creator
Create compelling infographics for free
Infographics make complex information eye catching, shareable and easily digestible. Most importantly, they play a crucial role in the increasingly visual world of marketing.
Canva’s infographic maker includes hundreds of free design elements, allowing you to experiment with data visualization like a pro.
